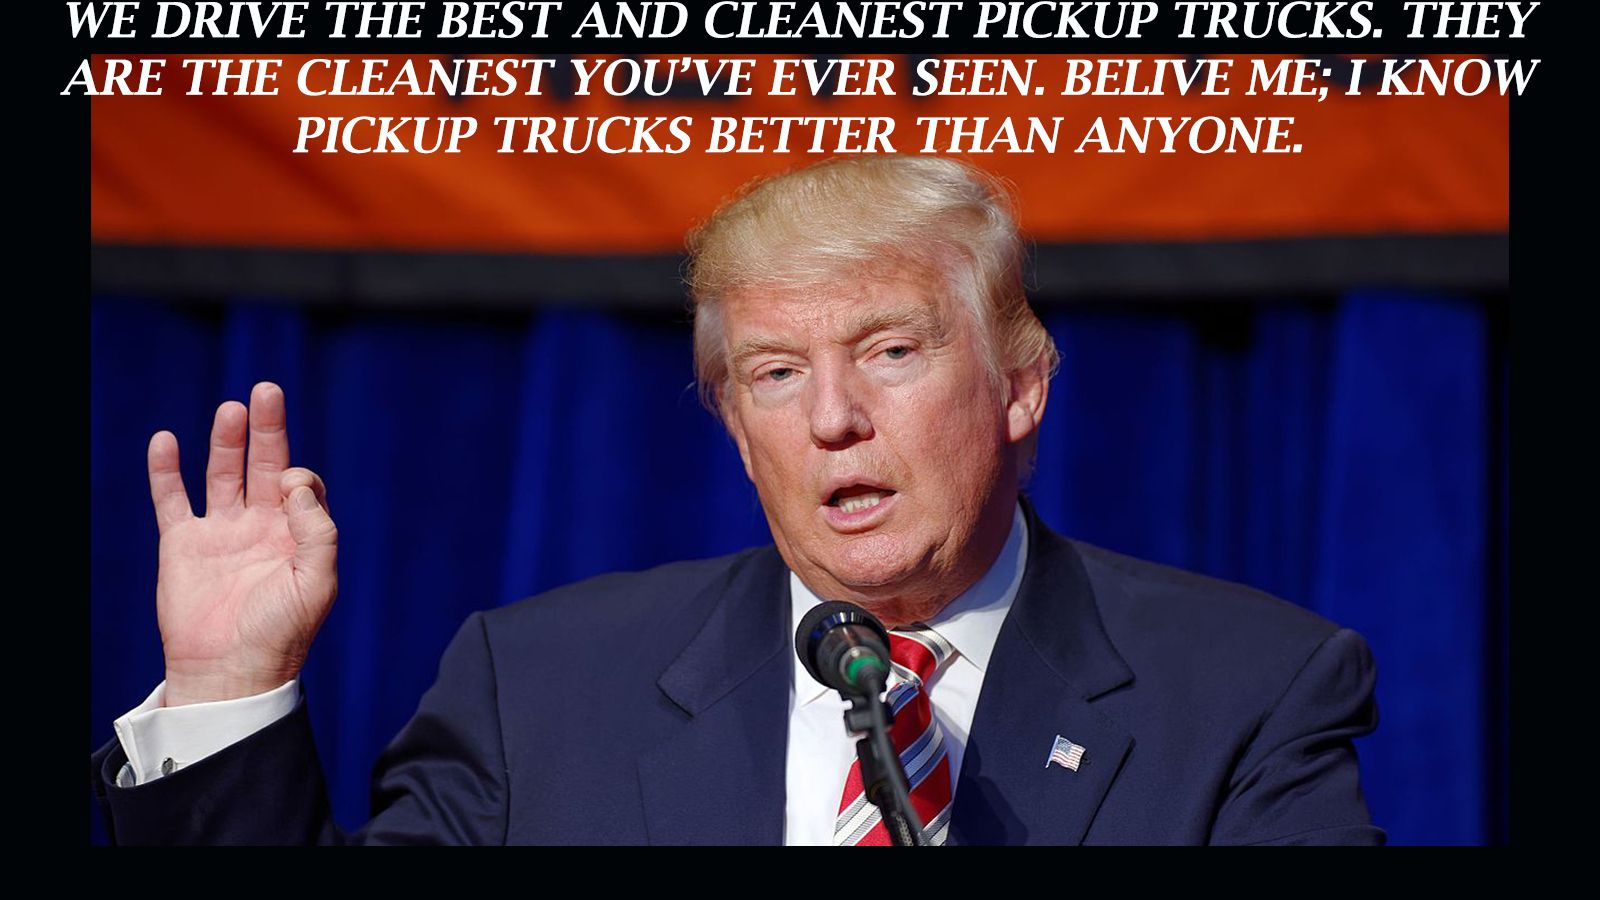
Stanford University put together a study based on millions of images from Google Street View and voting\demographic data to come up with a shocking but expected result: Trump supporters (Republicans) love their big trucks while areas that voted for Hillary (Democrats) have significantly more sedans. And, to top it off, the Toyota Prius is the most popular car in San Francisco – pretty much the liberal capital of the world and one of the smuggest places you can visit. Big surprise here, right?
Stanford’s Pickup Truck and Sedan Study
The researchers from Stanford University used an artificial intelligence algorithm (let’s hope that, for the sake of accuracy, it isn’t biased to the left or right) to sift through millions of images from Google Street View, demographic data, and voting data to determine which areas were Republican or Democrat based only on the cars found throughout the city. The study found that if there are more pickup trucks in a neighborhood, there is an 82-percent chance it voted Republican. If there are more sedans, there’s an 88-percent chance it voted Democrat. There’s no specific data on the Toyota Prius aside from it being the most popular vehicle in San Francisco, but it’s been the liberal, save-the-earth, green-car poster car for years now, so do we really even need that data to confirm that truth? Yeah, I didn’t think so.
The whole point of this study was to see what could be done, census-wise, by computer automatically instead of the traditional door-to-door surveys conducted by The American Community Survey, whose canvassing, by the way, costs around $250 million in taxpayer money annually.
“These types of approaches will be most useful in places where it is very expensive to perform a survey based census,” said Timnit Gebru – lead author of the research paper completed at the end of the project. “While the US has many resources to conduct such studies, there are other countries in the world where this is not the case. Using publicly available data could allow countries to understand the distribution of income in different regions or other demographic characteristics,” he continued.
And, while cars were used for this study, they are only one data point that can be used: “While we used cars in this study, what we wanted to show was that such work is possible using publicly available images and computer vision.”
As you can see, there’s a lot more than meets the eye, and it’s not just about political data gathering. A study like this can be used to collect all kinds of data – it’s just funny and provocative that one of the most popular stereotypes since Donald Trump’s election is actually true – go figure.
References
Read more Donald Trump news.

