Traffic snarls. You feel so helpless, and the worst thing of all, you will not see the end of it. And when it does, you pray this will never happen to you again. But as you know, it always comes back to haunt you. We are always in shock and denial, and even though we knew it was coming, we always find ourselves amazed at the hour-long standstill line.
Luckily for some of us, we ride on puny two wheels. Zipping through the congestion became a tad bit easier for us, and we take that little pleasure of happiness when we get to squeeze through tight spots to get in front of the line. Thank god for lane splitting.

But that is the thing. Riders still suffer in heavy traffic situations with facing commuting costs of fuel and parking, traffic crashes and road rage. It all comes down to highway planning that includes better connectivity and conditions of the road amongst other minor and major issues.
A German auto website, Kfzteile24, conducted a research and has tabled ten different commuting factors and have ranked 100 major metro cities across the globe based on congestion ratings, safe commuting and road qualities.
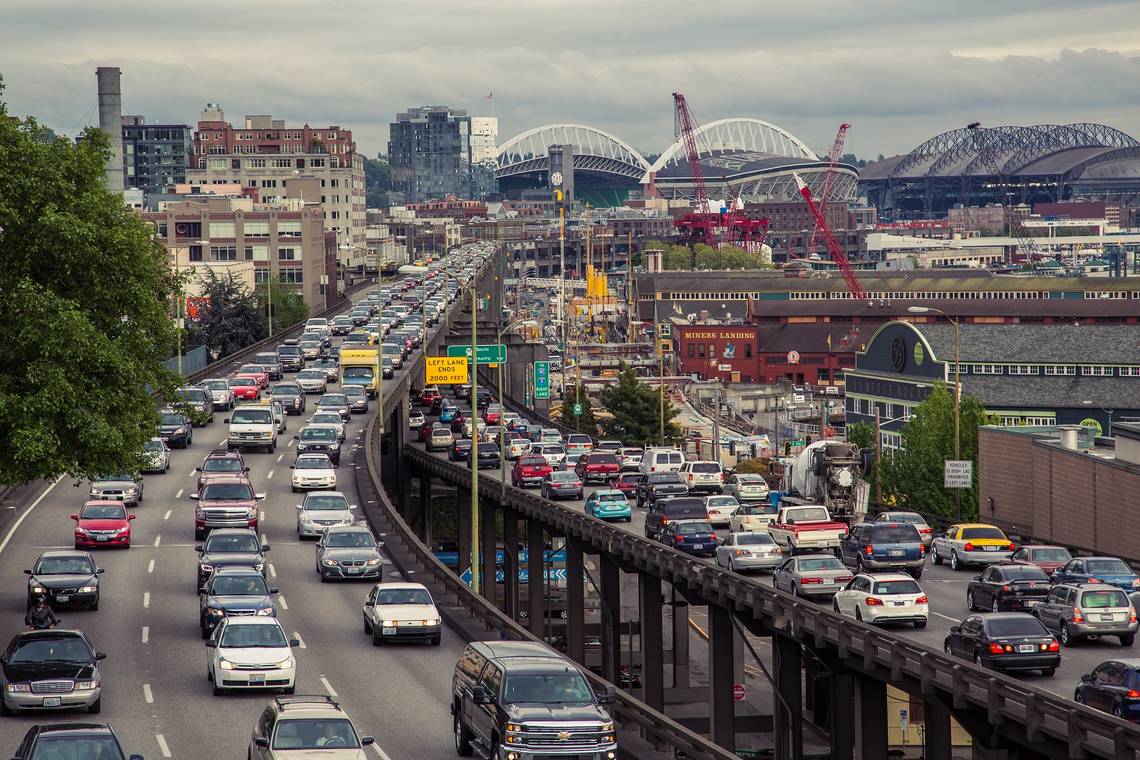
American cities included in the list are Seattle (#16) being the best city in the US for ease of commuting, San Antonio (#23), Austin (#41), Philadelphia (#43), Boston (#50), Chicago (#52), San Diego (#56), Miami (#65), New York (#70) and Los Angeles (#76) being the worst city in the US for commuting.
Traffic congestions:

Congestion directly affects the cost of commuting with more fuel being used up in waiting times and idling in traffic snarls. This will also affect the air quality in deteriorating with more and more fuel getting burnt up just to stand still.
Studied under the TomTom Traffic Index, the worst city affected by congestion is in Kolkata, India, having a score of 69%. The least congested cities are Bern in Switzerland and the Dutch city of Rotterdam that share 19% index.

Kolkata has an estimated population of 4.6 million whereas Bern in Switzerland has a mere 406,900 and Rotterdam has 633,471 people.
When comparing the American cities, the least congested city is San Antonio 20%. Philadelphia 23%, Austin 25%, Chicago 26%, San Diego 27%, Boston 28%, Miami 30%, Seattle 34%, New York 35%, and the highest congested city is Los Angeles with 45%.
Cost for a liter of fuel:

Gas in Lagos, Nigeria, costs at just around $0.46 being the least, and the highest fuel cost is in Hong Kong at $1.94.
Fuel cost across all US cities at the time of creating the chart was at $0.70. Today, it stands at $0.76 (at the time of signify this article).
Cost of public transport:

Public transports provided by the government of the country is for the general public where they share the mode of transportation for commuting. They may include city buses, trolleybuses, trams (or light rail) and passenger trains, rapid transit (metro/subway/underground, etc.) and ferries.
This usually helps cities cope with congestion since those many private vehicles will be not plying on the same roads. But it is also important that the prices remain invariably cheaper for the people to opt for them.

Unluckily, the city of Tokyo in Japan charges the highest for using public transportation which scores a full 10.00. Ulaanbaatar in Mongolia has the cheapest public transportation fares with the lowest score of 1.00 on the index chart.
Miami gets the cheapest fares with 2.85. San Diego 3.56, Los Angeles 4.22, San Antonio 4.96, Austin 5.21, Philadelphia 5.30, Boston 6.94, Seattle 8.27, Chicago 9.26 and with the highest fares in New York with 9.42.
Parking costs:

Unless you have parked in your driveway or your garage, most public places and city streets you end up visiting will charge you with a parking fee. This could sometimes affect the congestion since people might end up preferring either using public transports and pooling just because they will not have to pay these parking charges.
Our very own New York has the highest parking charges at a whopping $27.61 whereas Kolkata in India charges a mere $0.31.
In comparison, Austin and Miami have the least parking fee at $6.07. Los Angeles, San Antonio, and San Diego charges $10.12. Seattle $10.61, Chicago $15.16, Boston $16.44 and Philadelphia $17.19.
Speed to the airport:

The average speeds to the airports from the downtowns of every city is a major consideration for a few when they have to look out for a place to stay or work.
The city having the least average speed is Mumbai in India with a slow 8.10 mph whereas Oslo in Norway boasts of a fast 44.10 mph to the airport.
The slowest moving traffic to the airport in the US is in New York and San Diego with 11.20 mph. Chicago 13.80 mph, Austin 16.20 mph, Boston 16.80 mph, Philadelphia 18.70 mph, Miami 19.40 mph, Los Angeles 20.50 mph, San Antonia 24.90 mph and the fastest is at Seattle with 36.10 mph.
Air Quality Index:

The Air Quality Health Index provides a number from 1 to 10+ to indicate the level of health risk associated with local air quality that is majorly affected due to the pollution in the air. 1 being the lowest risk and 10+ being the highest risk.
The city with the worst Air Quality is Lagos in Nigeria who has a 1.00 on the index while the cleanest air is available in Calgary in Canada with 10.00 on the index.
The worst American air is in Chicago with 6.64 in the index. Los Angeles 7.27, Boston 7.36, Miami 7.55, Philadelphia 7.73, Austin 8.18, New York 8.55, San Antonio 8.64, San Diego 9.00 and Seattle with the cleanest at 9.82.
Crash Injuries:

With more and more automobiles on the road, the risk of crashes are also more and invariably the injuries. Of course, negligence and road quality plays a major role too.
The safest city to commute with the least crash injuries is in Switzerland with three Swiss cities (Basel, Bern, Geneva) scoring a perfect score of 10.00, while the worst was Bangkok with 1.00.
All cities in the states are touted to be dangerous with a score of 3.10 across.
Road Quality:

This is one of the significant contributions to crashes, injuries and traffic congestion in major metropolitan cities.
The worst roads are found in Bucharest in Romania with a paltry 1.00. A perfect score of 10.00 is scored by Singapore, Helsinki in Finland, Manchester in the UK, and the French cities of Marseille, Bordeaux, Paris, and Nice. Although Manchester has scored a perfect 10.00 with having the best road quality, it scored abnormally bad on crashes with 3.01.
Luckily, all cities in the states enjoy a good 8.43 grade road quality.
Road rage:

We all do have some bad days and some good. And invariably it affects our riding styles on that day. All is well and good until you are a happy person under the sun, but on that unlucky day, your head is filled with all kind of thoughts, and in a jiffy, all hell can break loose.
That burning rage of anger will make you do some regrettable stuff including chasing that other driver at breakneck speeds, darting other road users, pounding on hoods, yelling and threatening. And this is what some may rather avoid by choosing to use public transport instead.

The city with the most hot-headed road users are found in St Petersburg in Russia with the worst score of just 1.00. Meanwhile, Helsinki in Finland and Bordeaux in France score a full 10.00 on the charts to be the coolest riders in the entire world.
Folks from New York get a gnarly 2.58 followed by Miami 2.76, Los Angeles 3.68, Chicago 4.22, Boston 5.81, Philadelphia 6, Austin 7.35, San Diego 8.13, Sant Antoni 8.22 and Seattle being the friendly 9.37.
The results are tabulated below for your reference. Except for the fuel and parking charges indicated in US$, 1.00 signifies the worst conditions and 10.00 signifies the best.
|
RANK |
City |
Country |
Traffic jams |
Fuel in US$ |
Public transport |
Parking cost in US$ |
Speed to the airport |
Air quality |
Crash injuries |
Road quality |
Road rage |
|
1 |
Dussel |
Germany |
20% |
1.52 |
8.88 |
1.74 |
21.2 |
5.55 |
7.03 |
9.23 |
8.96 |
|
2 |
Dubai |
UAE |
26% |
0.48 |
3.81 |
4.54 |
31.70 |
8.00 |
9.13 |
8.24 |
8.65 |
|
3 |
Zurich |
Switzerland |
31% |
1.42 |
9.59 |
3.65 |
25.50 |
7.00 |
8.78 |
9.80 |
9.86 |
|
4 |
Tokyo |
Japan |
26% |
1.14 |
10.00 |
4.18 |
30.50 |
4.27 |
6.94 |
8.83 |
8.45 |
|
5 |
Basel |
Switzerland |
27% |
1.42 |
9.01 |
2.55 |
17.50 |
7.64 |
10.00 |
9.80 |
9.91 |
|
6 |
Singapore |
Singapore |
38% |
1.44 |
8.56 |
1.39 |
32.40 |
3.45 |
8.69 |
10.00 |
8.25 |
|
7 |
Dortmund |
Germany |
23% |
1.49 |
7.39 |
1.74 |
19.90 |
5.18 |
7.03 |
9.23 |
9.01 |
|
8 |
Vienna |
Austria |
31% |
1.26 |
9.75 |
3.94 |
28.00 |
5.09 |
5.81 |
9.60 |
9.87 |
|
9 |
Munich |
Germany |
30% |
1.50 |
9.26 |
2.09 |
27.40 |
6.73 |
7.03 |
9.23 |
7.28 |
|
10 |
Calgary |
Canada |
20% |
0.93 |
8.27 |
10.96 |
26.80 |
10.00 |
5.19 |
8.83 |
7.19 |
|
11 |
Bern |
Switzerland |
19% |
1.42 |
8.65 |
2.78 |
12.40 |
6.45 |
10.00 |
9.80 |
9.78 |
|
12 |
Stuttgart |
Germany |
28% |
1.50 |
8.06 |
2.09 |
24.90 |
5.73 |
7.03 |
9.23 |
8.18 |
|
13 |
Montreal |
Canada |
29% |
0.93 |
9.01 |
7.04 |
23.00 |
8.82 |
5.19 |
8.83 |
8.81 |
|
14 |
Toronto |
Canada |
30% |
0.93 |
8.69 |
7.83 |
25.60 |
9.18 |
5.19 |
8.83 |
8.38 |
|
15 |
Helsinki |
Finland |
31% |
1.55 |
8.85 |
4.18 |
20.00 |
7.64 |
6.42 |
10.00 |
10.00 |
|
16 |
Seattle |
USA |
34% |
0.70 |
8.27 |
10.61 |
36.10 |
9.82 |
3.10 |
8.43 |
9.37 |
|
17 |
Frankfurt |
Germany |
28% |
1.51 |
7.64 |
3.13 |
20.50 |
4.73 |
7.03 |
9.23 |
8.78 |
|
18 |
Amsterdam |
Netherlands |
22% |
1.67 |
6.36 |
5.45 |
18.80 |
6.09 |
8.51 |
9.03 |
9.51 |
|
19 |
Perth |
Australia |
27% |
0.90 |
5.21 |
2.78 |
21.20 |
8.27 |
5.81 |
7.26 |
8.29 |
|
20 |
Essen |
Germany |
28% |
1.48 |
5.46 |
2.61 |
20.00 |
5.91 |
7.03 |
9.23 |
8.83 |
|
21 |
Madrid |
Spain |
25% |
1.29 |
3.97 |
2.90 |
24.30 |
7.91 |
8.17 |
8.83 |
6.15 |
|
22 |
Ottawa |
Canada |
28% |
0.93 |
7.52 |
6.66 |
18.10 |
9.91 |
5.19 |
8.83 |
8.45 |
|
23 |
San Antonio |
USA |
20% |
0.70 |
4.96 |
10.12 |
24.90 |
8.64 |
3.10 |
8.43 |
8.22 |
|
24 |
Geneva |
Switzerland |
29% |
1.42 |
8.87 |
3.57 |
11.20 |
7.27 |
10.00 |
9.80 |
9.73 |
|
25 |
Hamburg |
Germany |
33% |
1.49 |
8.42 |
1.74 |
12.50 |
6.82 |
7.03 |
9.23 |
9.26 |
|
26 |
Stockholm |
Sweden |
28% |
1.57 |
5.88 |
9.05 |
36.20 |
5.00 |
9.65 |
8.24 |
9.33 |
|
27 |
Marseille |
France |
29% |
1.46 |
4.06 |
2.67 |
29.90 |
4.09 |
6.42 |
10.00 |
8.45 |
|
28 |
Prague |
Czech Rep |
23% |
1.20 |
7.35 |
4.41 |
16.80 |
4.55 |
8.43 |
8.43 |
7.17 |
|
29 |
Graz |
Austria |
29% |
1.26 |
6.71 |
3.02 |
16.20 |
5.36 |
5.81 |
9.60 |
9.86 |
|
30 |
Rotterdam |
Netherlands |
19% |
1.67 |
8.76 |
4.64 |
13.10 |
6.00 |
8.51 |
9.03 |
6.54 |
|
31 |
Berlin |
Germany |
29% |
1.49 |
9.84 |
1.97 |
13.10 |
5.82 |
7.03 |
9.23 |
6.11 |
|
32 |
Barcelona |
Spain |
31% |
1.29 |
6.71 |
3.94 |
20.00 |
5.64 |
8.17 |
8.83 |
7.19 |
|
33 |
Cologne |
Germany |
34% |
1.51 |
6.94 |
2.09 |
20.60 |
5.45 |
7.03 |
9.23 |
7.03 |
|
34 |
Birmingham |
UK |
40% |
1.51 |
8.43 |
4.54 |
27.30 |
9.55 |
9.13 |
8.24 |
6.44 |
|
35 |
Bremen |
Germany |
32% |
1.51 |
8.22 |
2.67 |
11.20 |
7.09 |
7.03 |
9.23 |
8.81 |
|
36 |
Seoul |
Korea |
30% |
1.27 |
9.33 |
5.36 |
29.30 |
2.82 |
4.15 |
8.63 |
6.85 |
|
37 |
Oslo |
Norway |
30% |
1.83 |
8.09 |
6.15 |
44.10 |
6.36 |
8.08 |
4.33 |
9.48 |
|
38 |
Glasgow |
UK |
30% |
1.51 |
5.70 |
2.67 |
16.80 |
9.36 |
9.13 |
8.24 |
4.73 |
|
39 |
Bordeaux |
France |
40% |
1.46 |
6.94 |
2.78 |
13.80 |
6.45 |
6.42 |
10.00 |
10.00 |
|
40 |
Auckland |
New Zealand |
38% |
1.41 |
8.51 |
12.13 |
23.70 |
9.27 |
5.19 |
6.87 |
8.92 |
|
41 |
Austin |
USA |
25% |
0.70 |
5.21 |
6.07 |
16.20 |
8.18 |
3.10 |
8.43 |
7.35 |
|
42 |
Toulouse |
France |
29% |
1.46 |
4.64 |
3.13 |
13.20 |
7.36 |
7.03 |
9.23 |
7.91 |
|
43 |
Philadelphia |
USA |
23% |
0.70 |
5.30 |
17.19 |
18.70 |
7.73 |
3.10 |
8.43 |
6.00 |
|
44 |
Edinburgh |
UK |
29% |
1.51 |
8.09 |
5.94 |
13.70 |
6.18 |
9.13 |
8.24 |
6.17 |
|
45 |
Brisbane |
Australia |
28% |
0.90 |
4.22 |
14.72 |
17.40 |
8.73 |
5.81 |
7.26 |
8.42 |
|
46 |
London |
UK |
38% |
1.51 |
9.91 |
10.44 |
16.20 |
8.09 |
9.13 |
8.24 |
6.85 |
|
47 |
Wellington |
New Zealand |
34% |
1.41 |
7.77 |
3.82 |
10.70 |
9.64 |
5.19 |
6.87 |
8.94 |
|
48 |
Vancouver |
Canada |
39% |
0.93 |
8.18 |
5.87 |
15.00 |
9.73 |
5.19 |
8.83 |
5.59 |
|
49 |
Liverpool |
UK |
40% |
1.51 |
8.60 |
6.51 |
15.60 |
6.55 |
9.13 |
8.24 |
8.42 |
|
50 |
Boston |
USA |
28% |
0.70 |
6.94 |
16.44 |
16.80 |
7.36 |
3.10 |
8.43 |
5.81 |
|
51 |
Paris |
France |
27% |
1.46 |
9.50 |
4.99 |
15.00 |
4.45 |
6.42 |
10.00 |
2.31 |
|
52 |
Chicago |
USA |
26% |
0.70 |
9.26 |
15.16 |
13.80 |
6.64 |
3.10 |
8.43 |
4.22 |
|
53 |
Tallinn |
Estonia |
26% |
1.25 |
5.37 |
4.18 |
8.80 |
9.45 |
6.85 |
9.23 |
4.58 |
|
54 |
Budapest |
Hungary |
22% |
1.20 |
2.49 |
1.86 |
16.80 |
4.00 |
4.58 |
5.10 |
7.59 |
|
55 |
Melbourne |
Australia |
33% |
0.90 |
2.98 |
15.50 |
17.50 |
7.82 |
5.81 |
7.26 |
8.78 |
|
56 |
San Diego |
USA |
27% |
0.70 |
3.56 |
10.12 |
11.20 |
9.00 |
3.10 |
8.43 |
8.13 |
|
57 |
Adelaide |
Australia |
27% |
0.90 |
1.90 |
7.08 |
11.90 |
8.36 |
5.81 |
7.26 |
9.33 |
|
58 |
Lisbon |
Portugal |
36% |
1.57 |
7.19 |
2.09 |
8.10 |
9.09 |
4.50 |
9.80 |
4.73 |
|
59 |
Manchester |
UK |
29% |
1.51 |
9.10 |
5.89 |
14.30 |
1.36 |
3.01 |
10.00 |
7.21 |
|
60 |
Tel Aviv |
Israel |
39% |
1.69 |
5.63 |
1.72 |
21.90 |
2.64 |
8.34 |
6.47 |
3.68 |
|
61 |
Sydney |
Australia |
39% |
0.90 |
9.68 |
26.34 |
15.60 |
8.45 |
5.81 |
7.26 |
4.04 |
|
62 |
Cape Town |
South Africa |
35% |
0.96 |
7.19 |
1.02 |
17.50 |
2.18 |
1.09 |
6.87 |
3.70 |
|
63 |
Copenhagen |
Denmark |
32% |
1.61 |
5.79 |
4.41 |
16.20 |
4.82 |
4.67 |
5.50 |
9.35 |
|
64 |
Kuala Lumpur |
Malaysia |
43% |
0.49 |
2.82 |
1.06 |
30.50 |
2.73 |
1.35 |
7.84 |
4.22 |
|
65 |
Miami |
USA |
30% |
0.70 |
2.85 |
6.07 |
19.40 |
7.55 |
3.10 |
8.43 |
2.76 |
|
66 |
Nice |
France |
38% |
1.46 |
4.64 |
4.99 |
12.40 |
4.18 |
6.42 |
10.00 |
7.91 |
|
67 |
Johannesburg |
South Africa |
47% |
0.96 |
7.77 |
1.93 |
26.80 |
1.73 |
1.09 |
6.87 |
4.74 |
|
68 |
Riga |
Latvia |
23% |
1.14 |
2.57 |
2.90 |
18.10 |
3.55 |
4.06 |
3.54 |
5.28 |
|
69 |
Dublin |
Ireland |
43% |
1.44 |
4.47 |
3.19 |
9.40 |
8.91 |
7.99 |
7.84 |
6.65 |
|
70 |
New York |
USA |
35% |
0.70 |
9.42 |
27.61 |
11.20 |
8.55 |
3.10 |
8.43 |
2.58 |
|
71 |
Antwerp |
Belgium |
30% |
1.47 |
3.48 |
2.84 |
10.00 |
4.64 |
4.76 |
8.04 |
7.48 |
|
72 |
Brussels |
Belgium |
38% |
1.47 |
2.82 |
3.36 |
14.40 |
5.27 |
4.76 |
8.04 |
7.71 |
|
73 |
Athens |
Greece |
36% |
1.64 |
6.04 |
6.61 |
35.50 |
3.18 |
1.96 |
9.60 |
3.14 |
|
74 |
Santiago |
Chile |
43% |
1.13 |
2.08 |
2.74 |
22.40 |
2.00 |
2.83 |
8.24 |
4.55 |
|
75 |
Milan |
Italy |
27% |
1.63 |
1.99 |
6.03 |
34.90 |
3.27 |
4.93 |
5.70 |
4.19 |
|
76 |
Los Angeles |
USA |
45% |
0.70 |
4.22 |
10.12 |
20.50 |
7.27 |
3.10 |
8.43 |
3.68 |
|
77 |
Beijing |
China |
46% |
0.95 |
1.83 |
1.50 |
22.40 |
1.64 |
1.96 |
5.90 |
6.26 |
|
78 |
Shanghai |
China |
48% |
0.95 |
2.24 |
1.64 |
34.90 |
1.82 |
2.31 |
2.37 |
7.17 |
|
79 |
Rome |
Italy |
35% |
1.63 |
3.30 |
4.87 |
22.40 |
4.36 |
4.93 |
5.70 |
3.52 |
|
80 |
Buenos Airies |
Argentina |
42% |
1.30 |
4.96 |
2.01 |
25.60 |
4.91 |
2.75 |
3.16 |
1.92 |
|
81 |
Sofia |
Bulgaria |
29% |
1.11 |
2.66 |
1.18 |
13.20 |
2.91 |
4.41 |
2.17 |
3.02 |
|
82 |
Hong Kong |
China |
41% |
1.94 |
3.30 |
3.18 |
39.20 |
2.45 |
1.96 |
5.90 |
5.09 |
|
83 |
Warsaw |
Poland |
37% |
1.15 |
3.81 |
1.16 |
10.60 |
3.64 |
3.97 |
2.37 |
4.01 |
|
84 |
Moscow |
Russia |
41% |
0.70 |
4.96 |
3.34 |
18.10 |
3.73 |
1.79 |
1.77 |
2.12 |
|
85 |
Bangkok |
Thailand |
61% |
0.98 |
2.91 |
1.35 |
21.20 |
3.00 |
1.00 |
7.07 |
3.54 |
|
86 |
St Petersburg |
Russia |
44% |
0.70 |
6.04 |
3.34 |
17.40 |
3.73 |
1.79 |
1.77 |
1.00 |
|
87 |
Jakarta |
Indonesia |
58% |
0.63 |
1.09 |
0.38 |
17.50 |
2.09 |
2.66 |
3.93 |
3.68 |
|
88 |
Bucharest |
Romania |
50% |
1.11 |
2.31 |
0.57 |
16.20 |
3.91 |
4.32 |
1.00 |
3.99 |
|
89 |
Sao Paulo |
Brazil |
30% |
1.18 |
3.20 |
6.21 |
15.00 |
3.36 |
1.44 |
2.57 |
4.06 |
|
90 |
Rio de Janeiro |
Brazil |
37% |
1.18 |
3.56 |
4.13 |
12.50 |
2.55 |
1.44 |
2.57 |
4.51 |
|
91 |
Istanbul |
Turkey |
49% |
1.47 |
1.56 |
1.69 |
11.80 |
2.27 |
4.23 |
6.87 |
1.49 |
|
92 |
Mexico City |
Mexico |
66% |
0.92 |
5.46 |
6.97 |
17.50 |
3.09 |
2.92 |
6.09 |
4.62 |
|
93 |
Bogota |
Colombia |
48% |
0.75 |
1.56 |
5.22 |
12.50 |
2.36 |
4.93 |
4.53 |
1.22 |
|
94 |
Ho Chi Minh |
Vietnam |
64% |
0.79 |
1.16 |
1.10 |
14.90 |
1.91 |
1.26 |
2.57 |
5.77 |
|
95 |
Bangalore |
India |
64% |
1.12 |
1.32 |
0.86 |
18.70 |
1.45 |
2.40 |
4.13 |
1.94 |
|
96 |
Mumbai |
India |
67% |
1.12 |
6.04 |
0.95 |
8.10 |
1.55 |
2.40 |
4.13 |
3.20 |
|
97 |
Ulaanbaatar |
Mongolia |
65% |
0.63 |
1.00 |
2.00 |
21.80 |
1.18 |
1.61 |
1.20 |
4.19 |
|
98 |
Lagos |
Nigeria |
60% |
0.46 |
1.25 |
0.32 |
10.70 |
1.00 |
1.70 |
2.76 |
3.50 |
|
99 |
Karachi |
Pakistan |
59% |
0.66 |
1.38 |
0.56 |
11.20 |
1.09 |
2.22 |
3.54 |
1.81 |
|
100 |
Kolkota |
India |
69% |
1.12 |
1.41 |
0.31 |
11.20 |
1.27 |
2.40 |
4.13 |
4.24 |